Pivot Value Column Feature
This document describes the use of a value column list in a pivot table. This option is available on selected rows and columns in the pivot table. Users can change this by clicking on the setting icon available on just the right side of the selected row or column.
Objective
The objective of this document is to understand the Value column feature in the Pivot table. How you can pass column data on click even you haven't used it in the pivot.
Prerequisites
- Pivot Value column Feature Data.xlsx
- Pivot Value Column Data. ds
Download dependency files from here
info
Upload xlsx file in the shared resource section and upload .ds file in dataset section.
Steps to Follow
Follow the below steps to understand this functionality,
Create/Open the dashboard and add pivot from the widget library
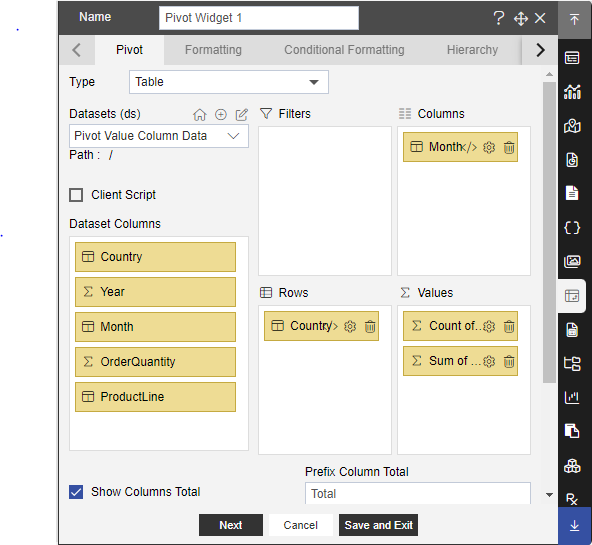
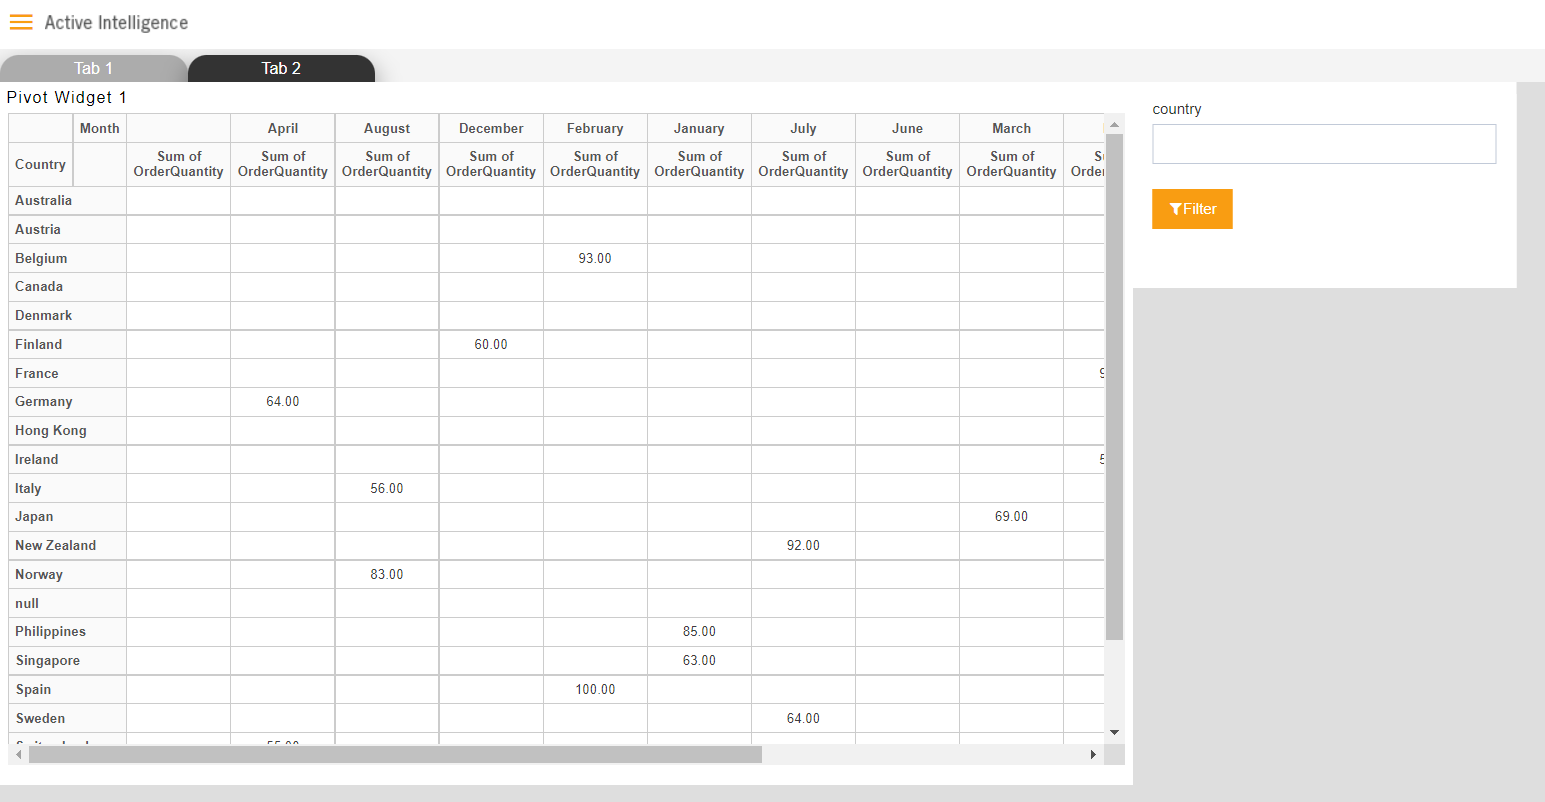
Select Dataset Pivot Value Column Data.ds from the dataset dropdown and drag & drop columns as shown in the below image,
Rows: Country
Columns: Month
Values: Sum of OrderQuantity
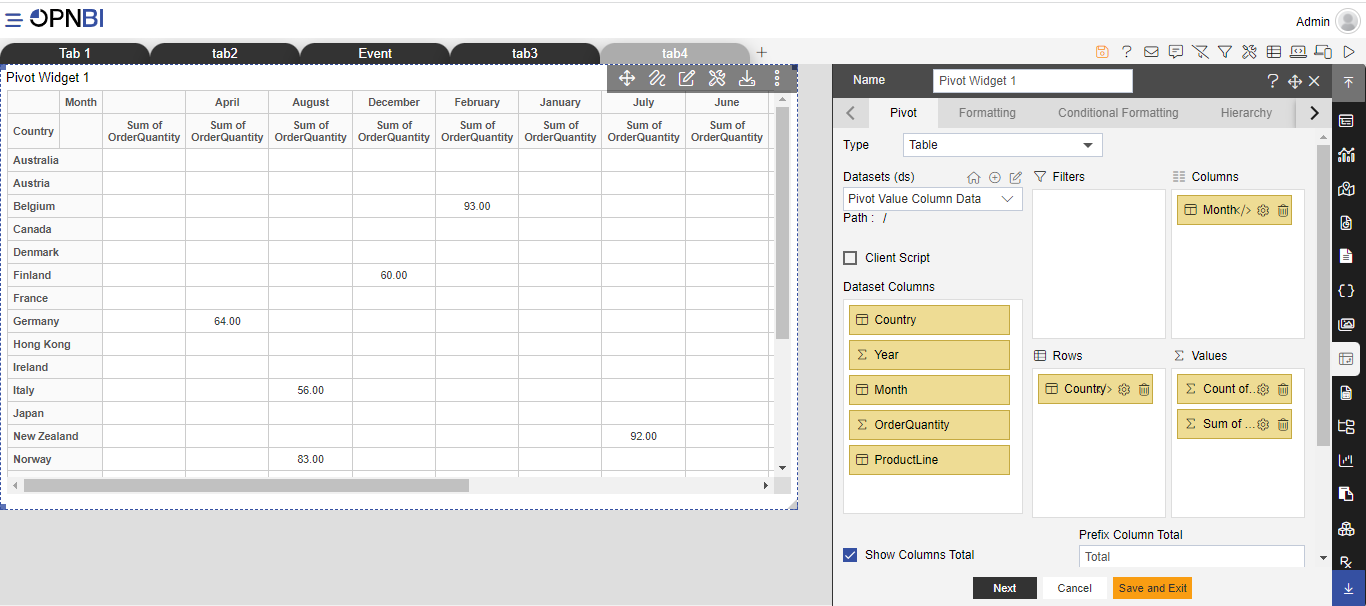
Click on save and exit and resize the pivot widget.
Hover on the widget and click on widget edit to open the widget edit window.
When you click on the setting icon of the selected row or column, by default in value list column or row name is selected. So, when the user writes an event, to pass row or column name on the click it will pass the selected row or column value. Let’s understand this by example and let’s create an event in a pivot that passes clicked row or column value and filter table data in the next tab.
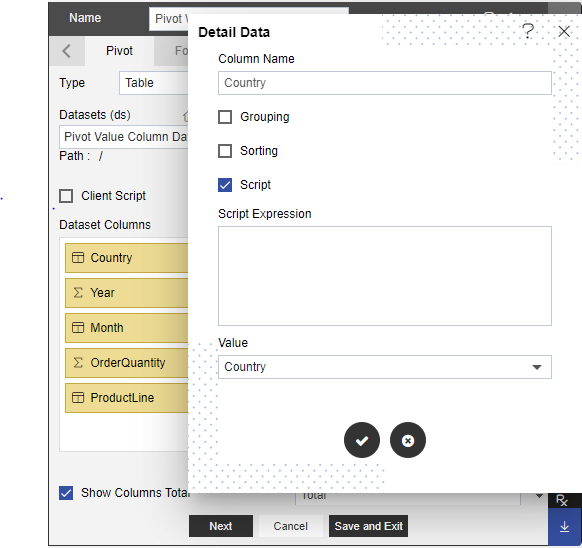
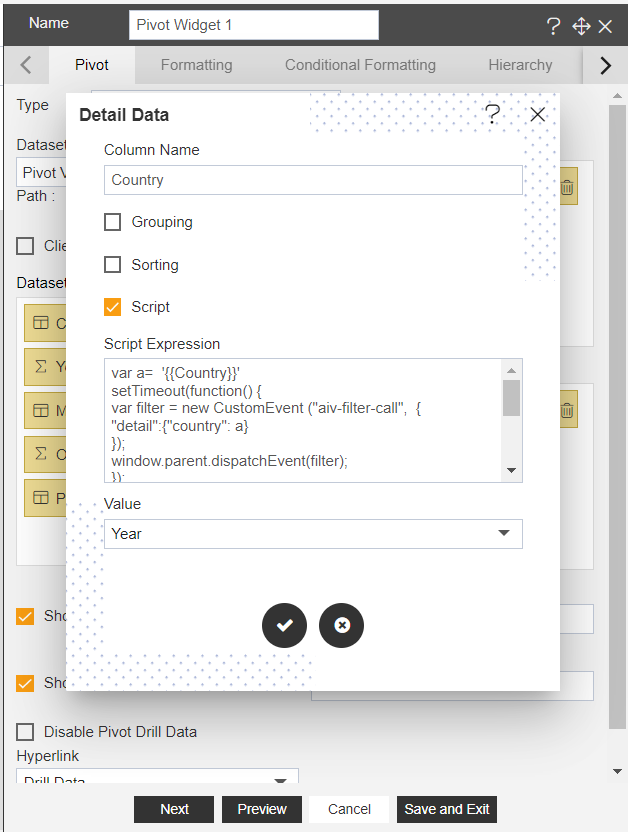
To add an event, click on the setting icon near the product line column,
Once clicked, several options will be displayed as below,
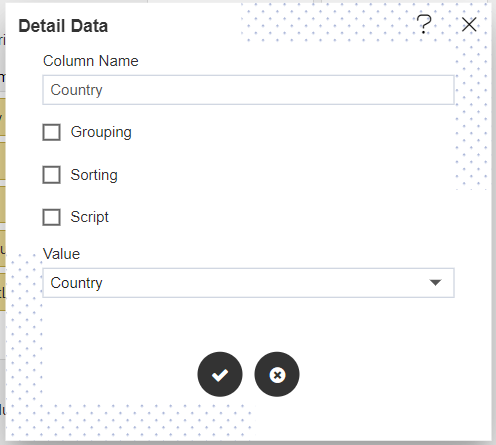
In the above screenshot, you can see Country is selected in the Value list
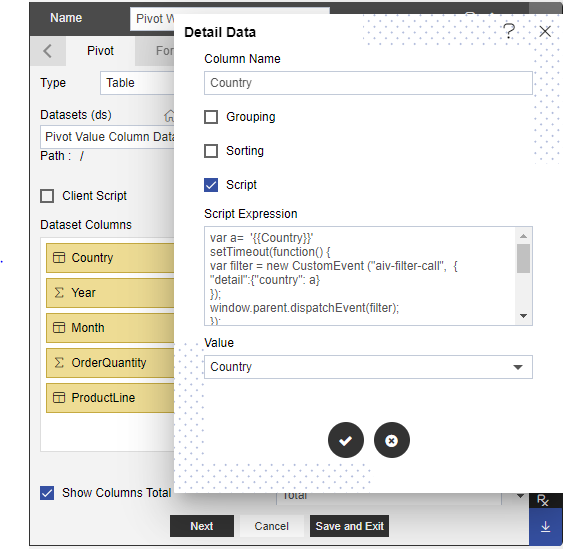
To add script, click on script checkbox and script space will be added under script checkbox as below,
In this script box, write a script to take column product line value, go to next tab, and filter table.
Sample Script
The sample script used here is below,
info
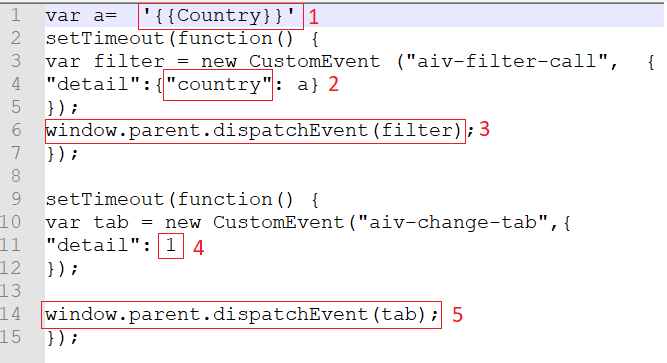
Please find the sample script here,
var a=  '{{Country}}'
setTimeout(function() {
var filter = new CustomEvent ("OPNBI-filter-call",  {
"detail":{"country": a}
});
window.parent.dispatchEvent(filter);
});

setTimeout(function() {
var tab = new CustomEvent("OPNBI-change-tab",{
"detail": 1
});

window.parent.dispatchEvent(tab);
});
- Script description is as follows;
- Is selected column name
- Filter name which will be created in 2nd tab for filtering table
- Event to call filter
- Tab ID on which I want to switch
- Event for tab change
Click on the accept button to save the changes
Click on the save and exit button to save the changes.
Create static filter as the same name as provided in the event (i.e. country) step number 2 keep the filter on “on change”
Create a new tab and add a table widget there with the Pivot Value Column Data dataset
Add the same filter you have created just one step above in this tab as well. Link this filter with a country column of the table widget. your tab 2 will look like this.
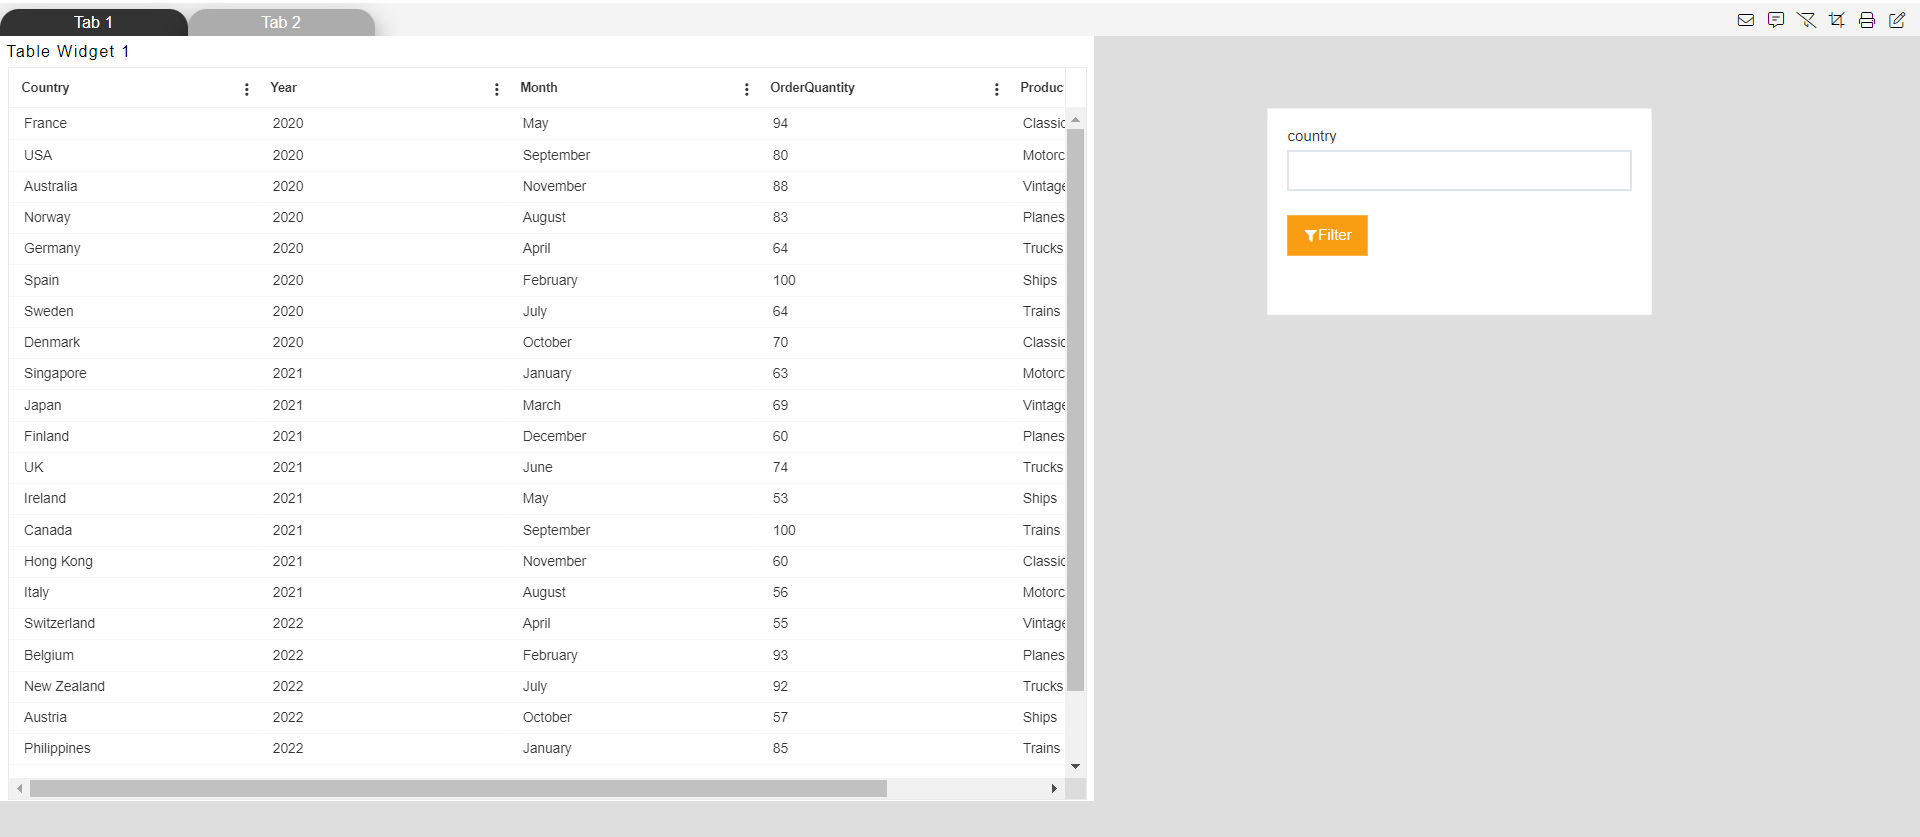
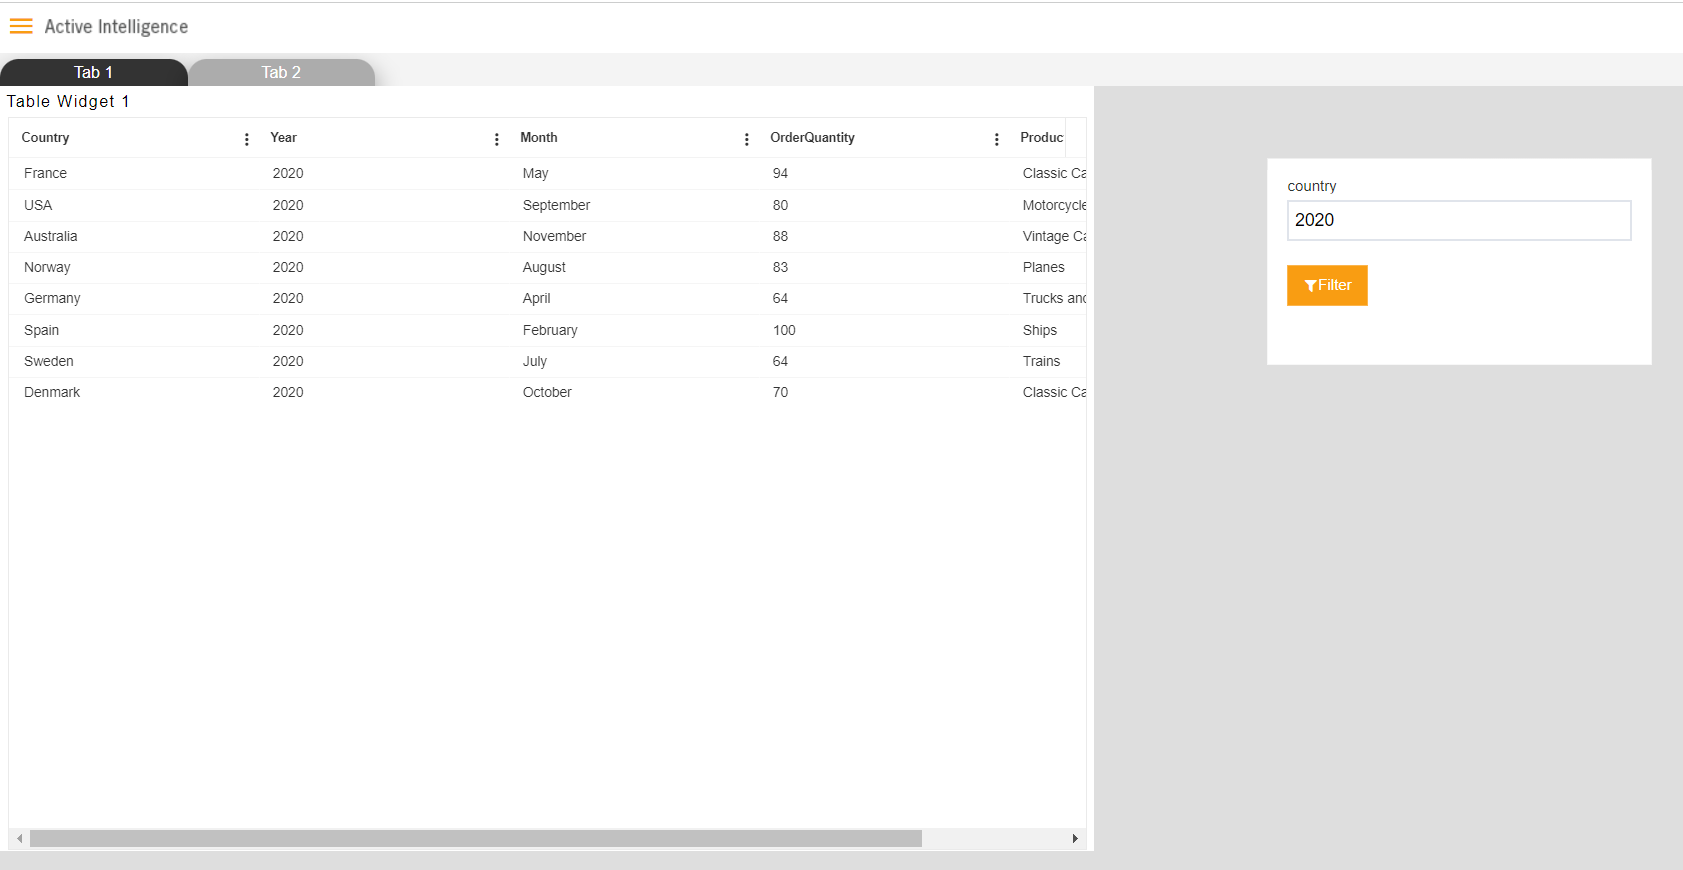
And Tab 1 will look like this,
Let's Check this event by clicking on any country in the pivot table
By doing so, it will take you to tab 2, and table data is filtered with the country you have clicked.
In the previous case whatever country we are clicking is passing to the next tab because in the value list by default product line column is selected.
If the user wants to pass some other column data associated with this country column, the value list came in to picture. For example, if I want to pass the year associated with clicked country then we use year in value drop-down list.
NOTE: The value column we are selecting instead of the country should have a unique value for that country. I.e., there should be only one unique year for each country
The dataset we are using has a unique year for each country. For demonstration purposes, this dataset is designed this way.
Go to pivot, edit widget, and click on the setting icon to open settings
From the value drop-down, we are selecting the year column
This means now when we click on any country name it will pass the associated year.
Now we have linked filter in tab 2 with country earlier but now we are passing year name now. So, change filter linking with the year column this time and delete existing linking with the country.
Save changes and go to preview mode
Now click on any country and it will take now year data for that country from the dataset and pass it to the next tab filter.
So now the table widget will filter with the year value of the clicked country. for example, if I click on country Australia it will pass year value 2020 in the event and filter tab 2 tables with this year value.